 AU
AU

Australia’s logistics industry has grown steadily amid the COVID-19 pandemic and international instability. This has been fuelled by eCommerce expansion, shifts in consumer behaviour, and the diversification of global supply chains.
But growth isn’t without its roadblocks. Infrastructure capacity, congestion, and geographic challenges all play a role in shaping how freight moves across the country.
And nowhere is that clearer than in the different ways each state relies on its freight modes. Discover all these as well as what these factors say about their economies and logistics ecosystems.
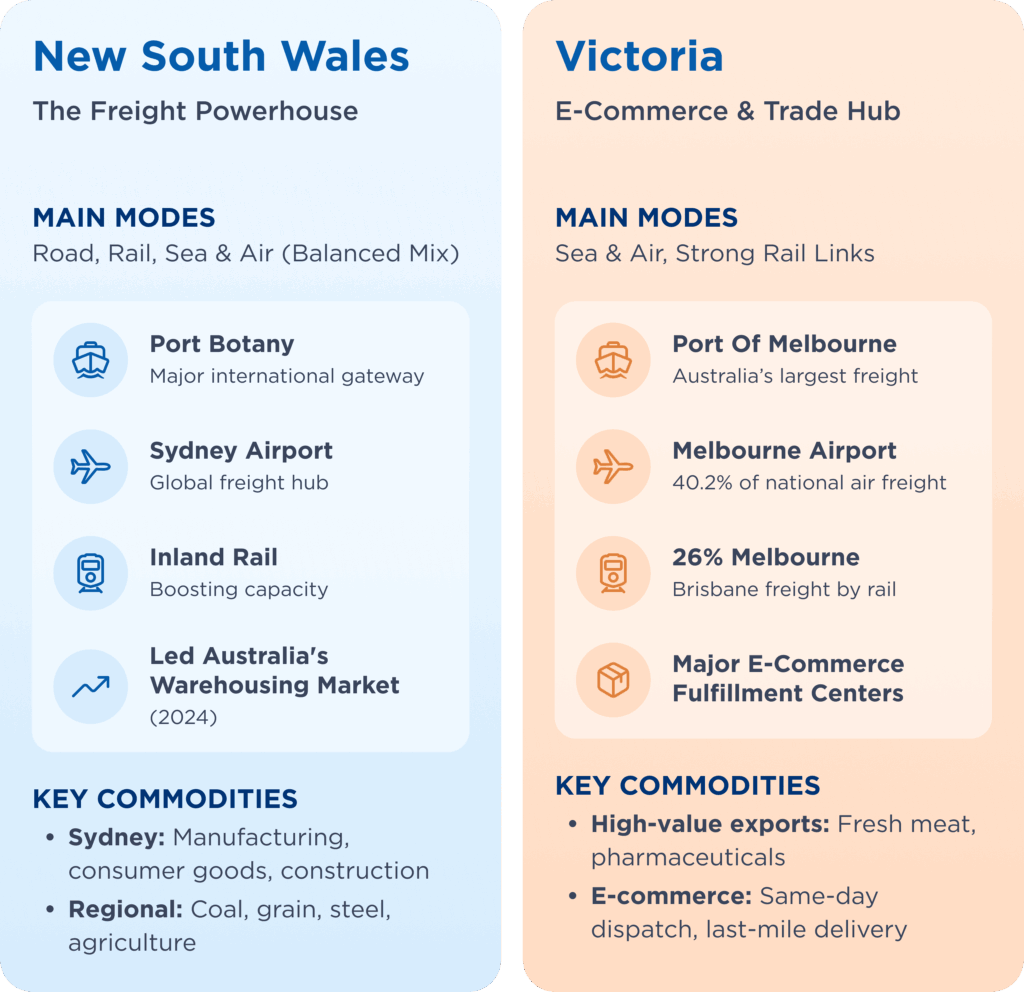
1. New South Wales: The Freight Powerhouse
Main freight modes: Road, rail, sea, and air (balanced mix).
NSW is a bit of an all-rounder. Port Botany and Sydney Airport connect it to the world, while Inland Rail is set to take some pressure off the highways. Sydney’s freight scene is driven by manufacturing, consumer goods, and construction materials, while regional areas pump out coal, grain, and steel.
What to watch: NSW
- Export demand from Asia is rising, particularly for premium agricultural products, creating new pressure on NSW supply chains to deliver with speed and consistency.
- Inland Rail will boost rail capacity into Port Botany, helping shift volume off roads.
- Port Botany and Sydney Airport are key international freight gateways.
- In 2024, NSW led Australia’s warehousing and storage market, driven by strong consumer demand, e-commerce growth, and port activity.
- Freight classifications are diversifying:
– In Greater Sydney: manufactured goods, construction materials, consumer goods, and waste
– In regional NSW: coal, grain, steel, forestry, and agriculture
2. Victoria: The E-Commerce and Trade Hub
Main freight modes: Sea and air, with strong rail links.
The Port of Melbourne moves more containers than any other in Australia, and Melbourne Airport is a leader in high-value exports like pharmaceuticals and fresh meat. Add in strong rail connections to Brisbane and Sydney, plus a ring of massive fulfilment centres around the city, and Victoria becomes the go-to for fast, high-volume freight. If it’s time-sensitive, chances are it’s moving through here.
What to watch: Victoria
- Melbourne Airport leads the nation in air freight, exporting 15,649 tonnes of high-value goods like fresh meat and pharmaceuticals worth up to $258.4 million.
In early 2024 alone, it handled 44,700 tonnes, or 40.2% of all national air-freight exports.
- The Port of Melbourne is Australia’s largest and busiest port, acting as a gateway for both domestic freight and international trade.
- 26% of all inter-capital freight between Melbourne and Brisbane moves by rail, highlighting the area’s importance in freight movement.
- Inland Rail is set to boost efficiency within this route, reducing transit times and enabling faster, larger-volume rail freight movement.
- E-commerce is reshaping infrastructure: Amazon, eBay, and local players have developed major fulfilment centres in Melbourne’s outer suburbs, optimising last-mile delivery and same-day dispatch.
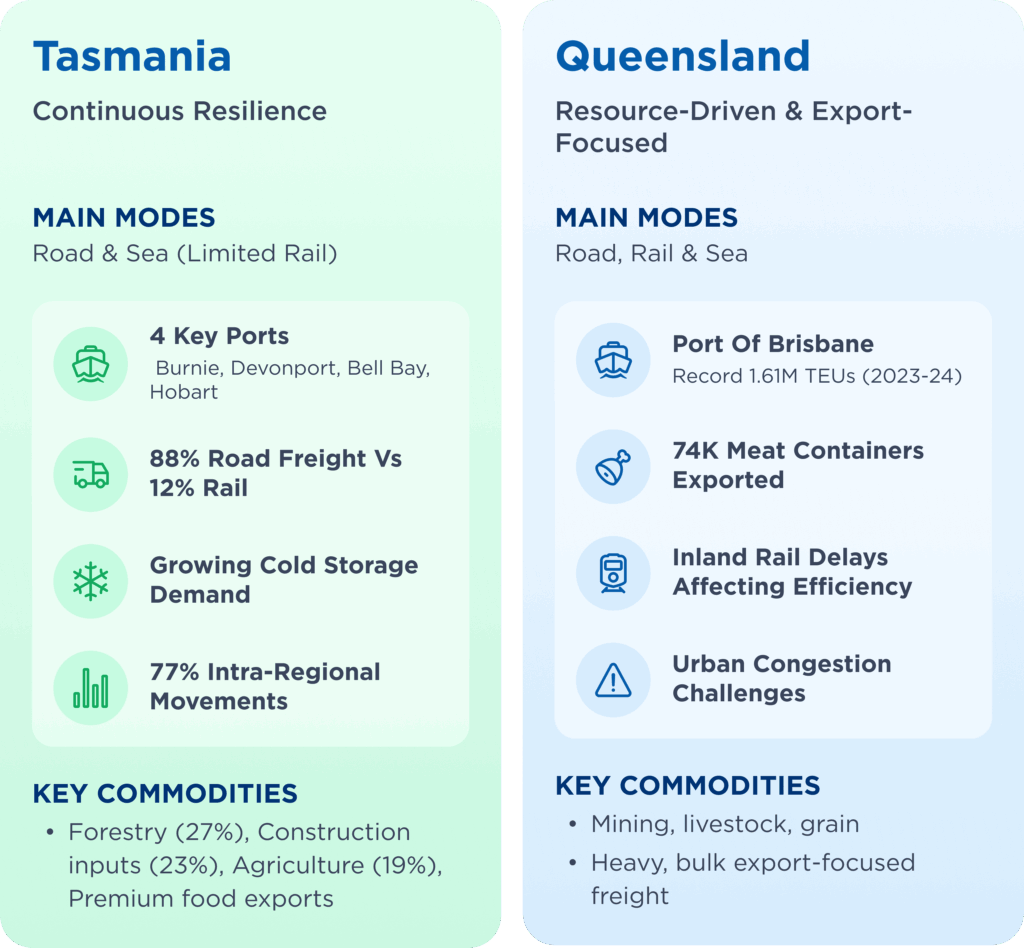
3. Tasmania: Continuous Resilience
Main freight modes: Road and sea (limited rail)
For Tasmania, the sea is the lifeline. Burnie, Devonport, Bell Bay, and Hobart handle almost everything in or out. Freight often moves one way because of regional imbalances, and cold storage demand is growing thanks to premium food exports. Success here depends on understanding its port-driven network and planning for the quirks of island logistics.
What to watch: Tasmania
- Port consolidation is driving massive volumes through just four key gateways: Burnie (5.3M tonnes), Devonport (3.8M tonnes), Bell Bay (3.6M tonnes), and Hobart (1.5M tonnes).
- Road dominance continues with 88% of freight moving by truck versus just 12% by rail—creating bottlenecks on key arterial routes.
- Regional imbalance shows the North West producing 11.7 million tonnes compared to just 5.7 million in the south, creating one-way freight flows.
- Tasmania leads Australia’s fastest-growing warehouse markets alongside Victoria, driven by agricultural exports and cold storage demand for the state’s premium produce.
- Freight classifications reveal resource dependency:
– Forestry leads at 27% of total volume (7.0M tonnes)
– Construction inputs at 23% (5.9M tonnes)
– Agriculture at 19% (5.0M tonnes)
- Intra-regional movements account for 77% of freight, suggesting strong local supply chains but limited cross-regional efficiency.
4. Queensland: Resource-Driven and Export-Focused
Main freight modes: Road, rail, and sea.
Queensland’s freight mix is built on mining, livestock, and grain. In other words, big, heavy, and export-focused. The Port of Brisbane is breaking container records, but rail efficiency in the north is held back by Inland Rail delays. With urban congestion adding extra headaches, flexibility in choosing the right mode at the right time can make all the difference.
What to watch: Queensland
- Port of Brisbane hit record volumes in 2023-24, handling 1.61M TEUs, 32M tonnes of trade, and nearly 74K meat containers, showing strong growth in high-value exports.
- Inland Rail faces delays, with environmental approvals “years away” and no construction timeline past North Star, risking the project’s impact.
- Ebenezer Intermodal Terminal near Ipswich could be a key freight hub for double-stacked trains but depends on Inland Rail’s timely delivery.
- Policy gaps persist, with poor alignment between state and national freight strategies and limited cross-jurisdictional cooperation.
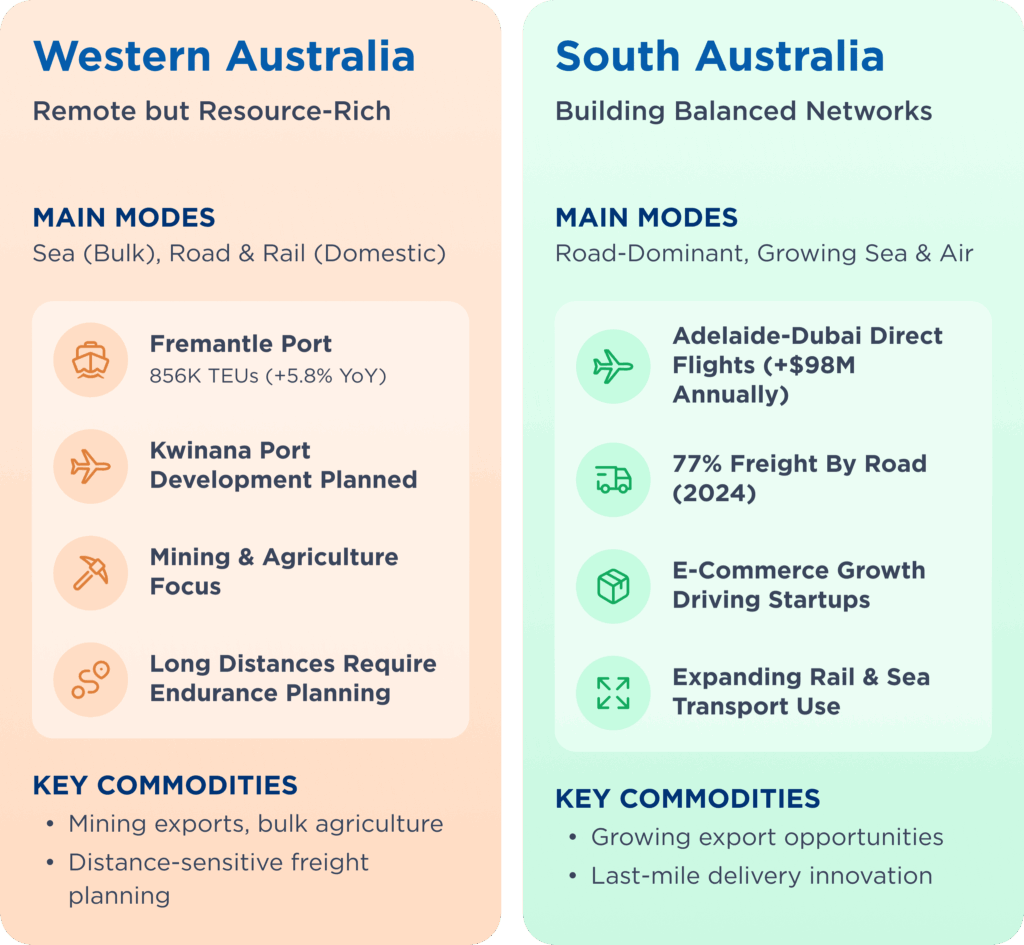
5. Western Australia: Remote but Resource-Rich
Main freight modes: Sea for bulk exports, road and rail for domestic freight.
Fremantle Port handles most container trade, but capacity limits are pushing plans for a bigger facility in Kwinana. Mining and agriculture are the heavy hitters here, and the distances involved mean freight planning isn’t just about cost, it’s about endurance and efficiency.
What to watch: Western Australia
- Fremantle Port delivered strong performance in 2023-2024, handling 856,526 TEUs with a 5.8% year-on-year increase, but faces location and capacity constraints that limit future expansion potential.
- Kwinana port development emerges as a critical long-term solution for container demand.
- In March 2022, the WA Government formed the Shipping and Supply Chain Taskforce to review the state’s shipping industry and its links to the east coast and international markets.
6. South Australia: Building Balanced Networks
Main freight modes: Road-dominant, with growing sea and air links.
Road still rules in South Australia, but that’s changing. New direct flights from Adelaide to Dubai are opening export opportunities, and state projects are improving port and rail access. Businesses that can work across multiple modes will be ready to take advantage as those connections grow.
What to watch: South Australia
- Adelaide Airport’s Dubai direct flights (launched 2024) expected to add $98M annually to air-freight exports, boosting trade links and reducing reliance on eastern state gateways.
- Road carries 77% of freight (2024), with efforts underway to expand rail and sea transport use.
- Australian Logistics Council advocating for dedicated freight routes, advanced safety tech, and stronger public awareness of infrastructure needs.
- Local startups capitalising on Adelaide’s ecommerce growth with specialised last-mile delivery for urban and regional markets.
The Bottom Line: What This Means for Your Business
Every state moves freight differently. Operators that pay attention to trends, patterns, and industry news are those that stay ahead of the pack. At the end of the day, it’s all about understanding which mode works best, avoiding costly dead runs, and moving freight the way the locals do.
With Transvirtual, you can see what is moving, where it is going, and how best to get it there in real time. That means you can pivot quickly, keep deliveries on schedule, and run a tighter, more profitable operation no matter which state you are in.

 Visit our US site